Working With Data
One Hot Encoding

start with our mountain bike example we worked through
import pandas as pd
bike = pd.read_csv('https://raw.githubusercontent.com/zacharski/ml-class/master/data/bike.csv')
bike = bike.set_index('Day')
bike
now divide into features and labels
features = ['Outlook', 'Temperature', 'Humidity', 'Wind']
bikeFeatures = bike[features]
bikeLabels = bike['Bike']
bikeFeatures
Now try to train a classifier
from sklearn import tree
clf = tree.DecisionTreeClassifier(criterion='entropy')
clf.fit(bikeFeatures, bikeLabels)
And we get the error:
---------------------------------------------------------------------------

    ValueError                                Traceback (most recent call last)

    <ipython-input-41-7c3bf8ef85f2> in <module>()
          1 from sklearn import tree
          2 clf = tree.DecisionTreeClassifier(criterion='entropy')
    ----> 3 clf.fit(bikeFeatures, bikeLabels)


    /usr/local/lib/python3.6/dist-packages/sklearn/tree/_classes.py in fit(self, X, y, sample_weight, check_input, X_idx_sorted)
        875             sample_weight=sample_weight,
        876             check_input=check_input,
    --> 877             X_idx_sorted=X_idx_sorted)
        878         return self
        879


    /usr/local/lib/python3.6/dist-packages/sklearn/tree/_classes.py in fit(self, X, y, sample_weight, check_input, X_idx_sorted)
        147
        148         if check_input:
    --> 149             X = check_array(X, dtype=DTYPE, accept_sparse="csc")
        150             y = check_array(y, ensure_2d=False, dtype=None)
        151             if issparse(X):


    /usr/local/lib/python3.6/dist-packages/sklearn/utils/validation.py in check_array(array, accept_sparse, accept_large_sparse, dtype, order, copy, force_all_finite, ensure_2d, allow_nd, ensure_min_samples, ensure_min_features, warn_on_dtype, estimator)
        529                     array = array.astype(dtype, casting="unsafe", copy=False)
        530                 else:
    --> 531                     array = np.asarray(array, order=order, dtype=dtype)
        532             except ComplexWarning:
        533                 raise ValueError("Complex data not supported\n"


    /usr/local/lib/python3.6/dist-packages/numpy/core/_asarray.py in asarray(a, dtype, order)
         83
         84     """
    ---> 85     return array(a, dtype, copy=False, order=order)
         86
         87


    ValueError: could not convert string to float: 'Sunny'
    ```
We get the error because the string “Sunny” is obviously not a number. We need to one hot encode this DataFrame.
One Hot Encoding
I am going to show you one way that also gives you a good visualization. Then I will show you a slightly better way.
- Create a new Dataframe of the one-hot encoded values for the Outlook column.
- Drop the Outlook column from the original Dataframe.
- Join the new one-hot encoded Dataframe to the original.
1. Create the new DataFrame
bikeFeatures1 = bikeFeatures

one_hot = pd.get_dummies(bikeFeatures1['Outlook'])
one_hot
2. drop the original outlook column
bikeFeatures1 = bikeFeatures1.drop('Outlook', axis=1)
bikeFeatures1
3. Join the one hot encoded columns to the original DF
bikeFeatures1 = bikeFeatures1.join(one_hot)
bikeFeatures1
We could just repeat this for all the columns. But we can make it a bit more automatic.
def onehot(originalDF, categories):
  final = originalDF
  for category in categories:
    final = final.join(pd.get_dummies(final[category], prefix=category))
    final = final.drop(category, axis=1)
  return final
use the function to one hot encode the DataFrame
bikeFeatures2 = onehot(bikeFeatures, ['Outlook', 'Temperature', 'Humidity', 'Wind'])
bikeFeatures2
You can compare that to our original DataFrame:
bikeFeatures
So, in the one hot encoded version there is a ‘1’ when that instance has that features and a ‘0’ when it does not.
sklearn’s onehotencoder
Compressed Sparse Row format
AKA Yale Format
from sklearn.preprocessing import OneHotEncoder
enc = OneHotEncoder(handle_unknown='ignore')
bikeSparse = enc.fit_transform(bikeFeatures)
import scipy
bikeSparse
scipy.sparse.find(bikeSparse)
(array([ 2,  6, 11, 12,  3,  4,  5,  9, 13,  0,  1,  7,  8, 10,  4,  5,  6,
         8,  0,  1,  2, 12,  3,  7,  9, 10, 11, 13,  0,  1,  2,  3,  7, 11,
        13,  4,  5,  6,  8,  9, 10, 12,  1,  5,  6, 10, 11, 13,  0,  2,  3,
         4,  7,  8,  9, 12], dtype=int32),
 array([0, 0, 0, 0, 1, 1, 1, 1, 1, 2, 2, 2, 2, 2, 3, 3, 3, 3, 4, 4, 4, 4,
        5, 5, 5, 5, 5, 5, 6, 6, 6, 6, 6, 6, 6, 7, 7, 7, 7, 7, 7, 7, 8, 8,
        8, 8, 8, 8, 9, 9, 9, 9, 9, 9, 9, 9], dtype=int32),
 array([1., 1., 1., 1., 1., 1., 1., 1., 1., 1., 1., 1., 1., 1., 1., 1., 1.,
        1., 1., 1., 1., 1., 1., 1., 1., 1., 1., 1., 1., 1., 1., 1., 1., 1.,
        1., 1., 1., 1., 1., 1., 1., 1., 1., 1., 1., 1., 1., 1., 1., 1., 1.,
        1., 1., 1., 1., 1.]))
bikeFeatures2
So the Compressed Sparse Row format consists of three arrays. The first array represents the row number that contains a non-zero number. The second contains the column number, and the third contains the non-zero value.
- The first element of the second array is 0
- The first element of the first array is 2
- The first element of the third array is 1
This means that there is a 1 (3rd array) in column 0 (2nd array) row 2 (1st array)
The next entries in the arrays say that there is a 1 in column 0 row 6.
Even though this looks substantially different than a standard DataFrame we can still use it in sklearn:
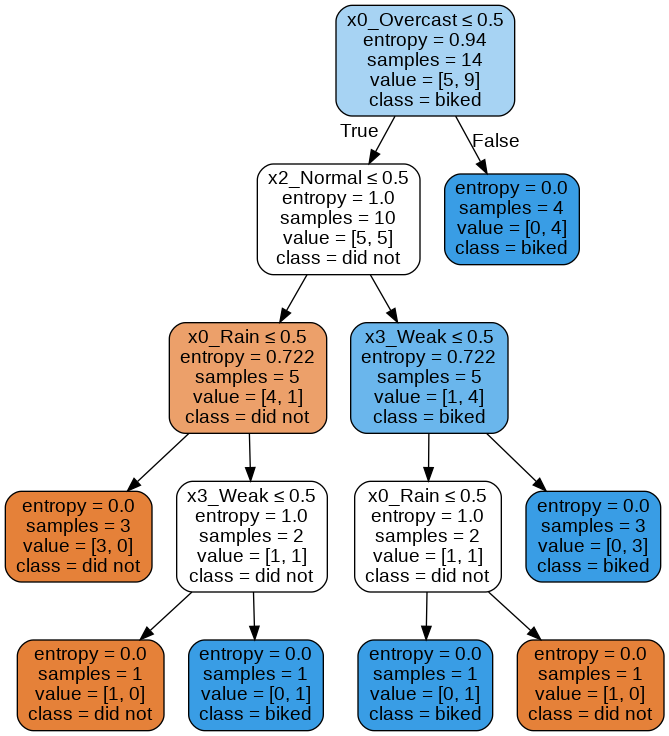
Fit the decision tree
clf.fit(bikeSparse, bikeLabels)
View decision tree
from IPython.display import Image
import pydotplus
dot_data = tree.export_graphviz(clf, out_file="biker.dot",
                         feature_names=enc.get_feature_names(),
                         class_names=['did not', 'biked'],
                         filled=True, rounded=True,
                         special_characters=True)
graph = pydotplus.graphviz.graph_from_dot_file("biker.dot")
#graph = pydotplus.graph_from_dot_data(dot_data)
Image(graph.create_png())

This looks fantastic!
cross validation and hyperparameters


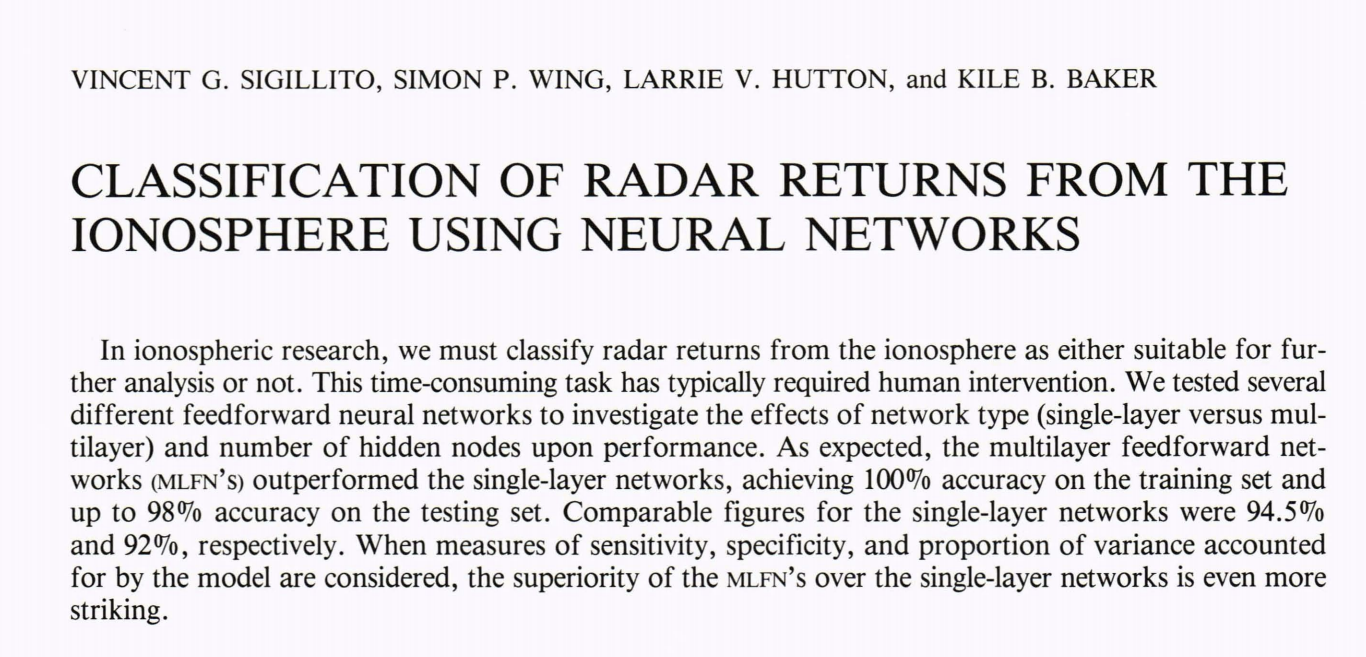
We have 16 antenna and 2 values from each. and the label we want to predict is whether the measurement is good or bad. (Is it suitable for further analysis)
import pandas as pd
radar = pd.read_csv('https://raw.githubusercontent.com/zacharski/ml-class/master/data/ionosphere.csv', header=None)
radar
We do our standard division of training and testing and features and labels.
from sklearn.model_selection import train_test_split
radar_train, radar_test = train_test_split(radar, test_size = 0.2)
radar_train
radar_train_features = radar_train.drop(34, axis=1)
radar_train_labels = radar_train[34]
radar_test_features = radar_test.drop(34, axis=1)
radar_test_labels = radar_test[34]

radar_train_labels
now create a classifier
from sklearn import tree
clf = tree.DecisionTreeClassifier(criterion='entropy')
Cross Validation Steps
1. import cross_val_score
from sklearn.model_selection import cross_val_score
2. run cross validation
scores = cross_val_score(clf, radar_train_features, radar_train_labels, cv=10)
cv=10 specified that we perform 10-fold cross validation. the function returns a 10 element array, where each element is the accuracy of that fold. Let’s take a look:
print(scores)
print("The average accuracy is %5.3f" % (scores.mean()))
[0.92857143 0.89285714 0.92857143 0.92857143 0.92857143 0.89285714
 0.82142857 0.89285714 0.96428571 0.89285714]
The average accuracy is 0.907
So scores contains the accuracy for each of the 10 runs.
Try with max depth of 5
from sklearn import tree
clf = tree.DecisionTreeClassifier(criterion='entropy', max_depth=5)
scores = cross_val_score(clf, radar_train_features, radar_train_labels, cv=10)
print(scores)
print("The average accuracy is %5.3f" % (scores.mean()))
[0.89285714 0.82142857 1.         0.82142857 0.92857143 0.89285714
 0.78571429 0.92857143 0.92857143 0.89285714]
The average accuracy is 0.889
Once we find the best hyperparameters.
Train a classifier on the entire training set.
clfF = tree.DecisionTreeClassifier(criterion='entropy')
clfF.fit(radar_train_features, radar_train_labels)
DecisionTreeClassifier(ccp_alpha=0.0, class_weight=None, criterion='entropy',
                       max_depth=None, max_features=None, max_leaf_nodes=None,
                       min_impurity_decrease=0.0, min_impurity_split=None,
                       min_samples_leaf=1, min_samples_split=2,
                       min_weight_fraction_leaf=0.0, presort='deprecated',
                       random_state=None, splitter='best')
Now test and report accuracy
predictions = clfF.predict(radar_test_features)
from sklearn.metrics import accuracy_score
accuracy_score(radar_test_labels, predictions)
0.8873239436619719
It is a hassle to do this manually
Let’s say we want to find the best settings for max_depthand we will check out the values, 3, 4, 5, 6, …12 and the best for min_samples_split and we will try 2, 3, 4, 5. That makes 10 values for max_depth and 4 for min_samples_split. That makes 40 different classifiers and it would be time consuming to do that by hand. Fortunately, we can automate the process using GridSearchCV.
First we will import the module:
from sklearn.model_selection import GridSearchCV
Now we are going to specify the values we want to test. For max_depth we want 3, 4, 5, 6, … 12 and for min_samples_split we want 2, 3, 4, 5:
hyperparam_grid = [
    {'max_depth': [3, 4, 5, 6, 7, 8, 9, 10, 11, 12],
     'min_samples_split': [2,3,4, 5]}
  ]
Create a decision tree classifier
clf = tree.DecisionTreeClassifier(criterion='entropy')
and perform the grid search
grid_search = GridSearchCV(clf, hyperparam_grid, cv=10)
note When we create the object we pass in:
- the classifer - in our case
clf - the Python dictionary containing the hyperparameters we want to evaluate. In our case
hyperparam_grid - how many bins we are using. In our case 10:
cv=10
now perform fit
grid_search.fit(radar_train_features, radar_train_labels)
which outputs …
    GridSearchCV(cv=10, error_score=nan,
                 estimator=DecisionTreeClassifier(ccp_alpha=0.0, class_weight=None,
                                                  criterion='entropy',
                                                  max_depth=None, max_features=None,
                                                  max_leaf_nodes=None,
                                                  min_impurity_decrease=0.0,
                                                  min_impurity_split=None,
                                                  min_samples_leaf=1,
                                                  min_samples_split=2,
                                                  min_weight_fraction_leaf=0.0,
                                                  presort='deprecated',
                                                  random_state=None,
                                                  splitter='best'),
                 iid='deprecated', n_jobs=None,
                 param_grid=[{'max_depth': [3, 4, 5, 6, 7, 8, 9, 10, 11, 12],
                              'min_samples_split': [2, 3, 4, 5]}],
                 pre_dispatch='2*n_jobs', refit=True, return_train_score=False,
                 scoring=None, verbose=0)
When grid_search runs, it creates 40 different classifiers and runs 10-fold cross validation on each of them. We can ask grid_search what were the parameters of the classifier with the highest accuracy:
grid*search.best_params*
this displays …
{'max_depth': 9, 'min_samples_split': 2}
we can return the best classifier
predictions = grid*search.best_estimator*.predict(radar_test_features)
and now get the accuracy
accuracy_score(radar_test_labels, predictions)


    0.8873239436619719